Thursday 19 January 2017
Federal Bank – Another Strong Quarter
We had
recommended Federal Bank to our investors on September 30, 2016 when the scrip
was trading at Rs 72. After our recommendation Federal Bank had posted strong
financial performance for the September 2016 quarter. With the demonetisation
taking place in between (On November 8, 2016) a lot of volatility was seen in
the Indian equity markets (with a negative bias). With demonetisation taking
place Banks were asked to focus on the change of currency and the overhang of
lesser currency in markets was expected to impact the GDP growth as well. Hence
Banks that were already reeling under the pressure had another challenge. However
the results of comparatively smaller banks like IndusInd Bank and South Indian
Bank indicated that there is hardly any impact of De-monetisation on the banks.
And if Federal Bank results are anything to go by, it seems that the Smaller
Banks are comparatively better placed than the larger peers.
Federal Bank for
the quarter ended December 2016 (Q3FY17) has posted a strong performance on all
the operational and financial parameters both on YoY and QoQ basis.
Operational Performance
On the
operational front, the Operating profit of the Bank increased by 45.91 percent YoY
to reach Rs. 474.90 crore as on December 31, 2016. The Net Profit increased by
26.39 percent YoY to reach Rs. 205.65 crore. Federal Bank earned a Net Interest
Income (NII) of Rs 791.39 crore for the Q3FY17. The Net Interest Margin of the
Bank stood at 3.32 percent showing and improvement of 1 basis point on Q-o-Q
basis and 28 basis points on Y-o-Y basis.
|
Particulars
|
Q3FY17
|
Q3FY16
|
% y-o-y growth
|
|
Net Interest Income
|
791.39
|
605.69
|
é30.66%
|
|
Other Income
|
263.33
|
182.82
|
é44.04%
|
|
Net Total Income
|
1054.72
|
788.51
|
é33.76%
|
|
Operating Profit
|
474.90
|
325.48
|
é45.91%
|
|
Net Profit
|
205.65
|
162.72
|
é26.39%
|
|
Rs in Crore
|
|||
As regards the deposits
and advances growth, CASA ratio improved to 34.66 percent as against 31.04
percent in September 2016 (On Expected line with Cash Deposits occurring due to
Demonetisation). On the advances front, traction was visible on segments like
retail, Agri, SME and Wholesale. Total advances for December 2016 stood at Rs
70439 crore as against Rs 65439 crore in September 2016.
Asset Quality – Improves Despite Pressure
The Gross NPA
and Net NPA of the Bank as at the end of the Quarter stood at Rs 1951.55 crore and Rs 1102.37 crore respectively. Gross
NPA as a percentage reduced to 2.77 percent (2.78 percent in September 2016) and
Net NPA as a percentage to Net Advances stood at 1.58 percent (1.61 percent in
September 2016). The Provision Coverage Ratio (including technical write-offs)
is 71.01 percent.
While it may not
look very good on superficial levels, there is lot to look at for detailed
numbers. Like fresh accretions were only Rs 273 crore as against Rs 386 core in
Q3FY16. Further it is the retail and SME Segment exposure that contributed to
major increase in Gross NPAs. However we feel that scenario is expected to
improve in both segments. Hence we would be surprised to see a significant
improvement on slippages front in March 2017 quarter.
Overall the
performance has been really good for the quarter and we maintain our target
price of Rs 94.
Financial Highlights
|
Business
Figures
|
As on
31.12.2016
(Rs. in Crore)
|
As on
31.12.2015
(Rs. in Crore)
|
Growth
(%)
|
|
Total Deposits
|
92235.65
|
74792.04
|
é23.32%
|
|
SB & Demand Deposits
|
32817.19
|
24439.60
|
é34.27%
|
|
Net Advances
|
69629.22
|
52752.81
|
é31.99%
|
|
Retail Advances
|
21309.78
|
16774.91
|
é27.03%
|
|
SME Advances
|
16323.99
|
14032.91
|
é16.33%
|
|
Agri Advances
|
6774.65
|
6062.09
|
é11.75%
|
|
Investments
|
28519.93
|
24647.33
|
é15.71%
|
|
Capital
|
|
|
|
|
Equity Capital
|
344.43
|
343.67
|
|
|
Net Worth
|
8601.24
|
8223.66
|
é4.59%
|
|
Capital Adequacy (%)
|
12.28%
|
14.32%
|
|
|
Tier I (%)
|
11.63%
|
13.74%
|
|
|
Tier II (%)
|
0.65%
|
0.58%
|
|
Thursday 29 December 2016
Grasim Industries Ltd – On the verge of breakout.
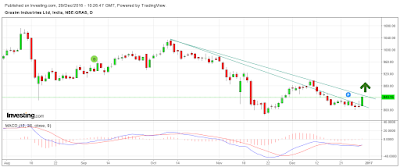
Grasim
Industries Ltd on a daily chart stock price is making higher high and higher
low pattern with increase in volumes, indicate positive outlook for the stock
price. Technically on daily chart stock price at Rs. 843 has touch the downward
sloping trend line any trade or closed above the same stock price can rally
towards previous high swing. Momentum Oscillator MACD has also given positive
crossover, which add more bullishness for the stock price.
If one were to go by the
volume data, a higher upswing is seen on the stock price. Trader or investor
can accumulate above Rs. 848 for the target of Rs. 1036 levels, with Rs. 800
stop loss on closing basis.
Tuesday 27 December 2016
ITC Ltd – Double Bottom Pattern
ITC
Ltd on a daily chart stock price is making higher high and higher low pattern with
increase in volumes, indicate positive outlook for the stock price. Technically
on daily chart stock price at Rs. 234.50 has given the breakout of descending triangle
pattern, also we witnessed a double bottom pattern, indicate stock price can
rally towards previous high swing, which look most likely. Momentum Oscillator
MACD has given the positive crossover, which add more bullishness for the stock
price.
If one were to go by the
volume data, a higher upswing is seen on the stock price. Trader or investor
can accumulate at Rs. 234 for the target of Rs. 258 levels, with Rs. 222 stop
loss on closing basis.
Monday 26 December 2016
Emami Ltd – Downward Sloping Trend Line
Emami
Ltd on a daily chart stock price is making higher high and higher low pattern with
increase in volumes, indicate positive outlook for the stock price. Technically
on daily chart stock price at Rs. 989 is on the verge of breakout of downward
sloping trend line at Rs, 990 level, any trade or closed above the same stock
price can rally towards previous high swing, which look most likely.
If one were to go by the
volume data, a higher upswing is seen on the stock price. Trader or investor
can accumulate above at Rs. 990 for the target of Rs. 1100 levels, with Rs.
930 stop loss on closing basis.
Friday 23 December 2016
Maruti Suzuki India Ltd – Downward Sloping Trend Line
Maruti
Suzuki India Ltd on a daily chart stock price is making higher high pattern
also stock price is trading above the 20 DMA, indicate positive outlook for the
stock price. Technically on daily chart stock price at Rs. 5193 has given the
breakout of downward sloping trend line at Rs, 5096 level, indicate stock price
can rally towards previous high swing, which look most likely.
If one were to go by the
volume data, a higher upswing is seen on the stock price. Trader or investor
can accumulate at Rs. 5190 for the target of Rs. 5535 levels, with Rs.
5033 stop loss on closing basis.
Thursday 22 December 2016
BEML Ltd – Rounding Pattern Breakout
BEML
Ltd on a daily chart stock price is making higher high and higher low pattern
also stock price is trading above the 20 DMA, indicate positive outlook for the
stock price. Technically on daily chart stock price at Rs. 968 has given the
breakout of rounding pattern at Rs, 938 level, indicate stock price can rally
towards previous high swing, which look most likely.
If one were to go by the
volume data, a higher upswing is seen on the stock price. Trader or investor
can accumulate at Rs. 968 for the target of Rs. 1100 levels, with Rs. 892 stop
loss on closing basis.
Wednesday 21 December 2016
Mahindra & Mahindra Ltd – Downward Sloping Trend Line
Mahindra
& Mahindra Ltd on a daily chart stock price is making higher high and
higher low pattern also stock price is trading above the 20 DMA, indicate
positive outlook for the stock price. Technically on chart stock price at Rs. 1185.10
is given the breakout of downward sloping trend line pattern at Rs, 1168 level,
indicate stock price can rally towards previous high swing, which look most
likely.
If one were to go by the
volume data, a higher upswing is seen on the stock price. Trader or investor
can accumulate at Rs. 1185 for the target of Rs. 1300 levels, with Rs. 1140
stop loss on closing basis.
Subscribe to:
Posts
(
Atom
)


